xkcd-gnuplot
How to plot xkcd-style functions with gnuplot!
It seems that all the rage these days is to get xkcd-style plots out of every plotting alternative out there. After seeing the renditions of the same idea in Mathematica, Matplotlib, R and even in LaTeX!, gnuplot also deserved a shot. This doesn't attempt to be anywhere close to how sophisticated some of those other attempts were, as gnuplot offers much less in terms of programmability or access to the graphics pipeline than some of them, but the end result is not too bad! Also, it can certainly be improved :)
Gnuplot source here: xkcd.gp.
Original font: http://antiyawn.com/uploads/Humor-Sans.ttf. Converted to .pfa here.
# Gnuplot file that plots a couple of functions in the xkcd style
# Not a proper rendition, as the axis are still straight lines
# Also, when plotting functions, the jiggling can only be done in
# the y coordinate. For datapoints, one can do the jiggling on both
# x and y.
# The proper way to do this would be to write a xkcd terminal for
# gnuplot, but this is way beyond the time that I can use on this...
# You can download the HumorSans font from here: http://antiyawn.com/uploads/Humor-Sans.ttf
# To use it in the eps terminal, you have to convert it to a postscript pfa format
# Since I already did that, you can just use the file included in this git repository.
set term postscript eps font 'HumorSans' fontfile 'Humor-Sans.pfa' 22
set output 'xkcd.eps'
# Some line types
set style line 10 lt 1 lc rgbcolor "#ffffff" lw 15 #thick white
set style line 11 lt 1 lc rgbcolor "#000000" lw 4 #black
set style line 1 lt 1 lc rgbcolor "#ff0000" lw 4 #red
set style line 2 lt 1 lc rgbcolor "#0000ff" lw 4 #blue
# No border with tics
set border 0
set noxtics
set noytics
# Show the axis
set xzeroaxis ls 11
set yzeroaxis ls 11
#Arrow end to the axis
set arrow from graph 0.95, first 0 to graph 1, first 0 size 2,3 front
set arrow from first 0, graph 0.95 to first 0, graph 1 size 2,3 front
set yrange [-1.1:1.1]
set xrange [-1:15]
set key bottom
set label 'Wasted time' at 11,0.7 right
set arrow from 11.1,0.7 to 12,((12/15.0)**2) ls 11
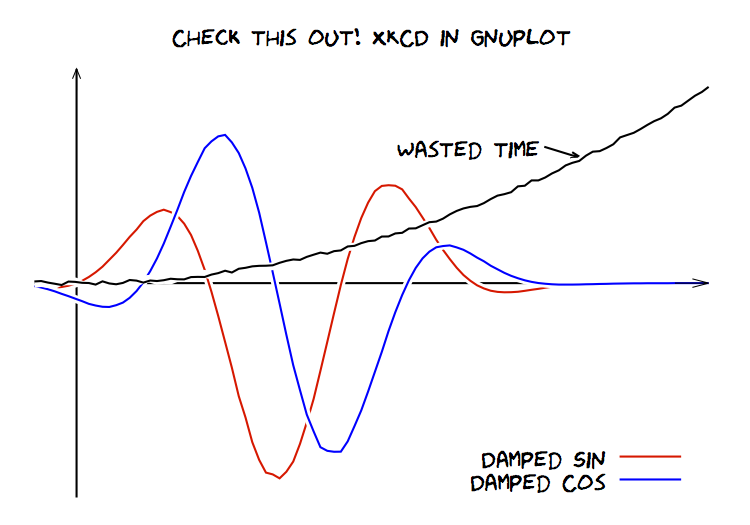
set title 'Check this out! XKCD in Gnuplot'
#Jiggling functions
range = 2.0 #Range for the absolute jiggle
jigglea(x) = x+range*(2*(rand(0)-0.5)*0.005) #Absolute (as a fraction of the range)
jiggle(x) = x*(1+(2*rand(0)-0.5)*0.015) #Relative +-1.5% (as a fraction of the y value)
dpsin(x) = sin(x) * exp(-0.1 * (x - 5) ** 2)
dpcos(x) = - cos(x) * exp(-0.1 * (x - 5) ** 2)
plot jiggle(dpsin(x)) ls 10 t '', \
jiggle(dpsin(x)) ls 1 t 'Damped Sin',\
jiggle(dpcos(x)) ls 10 t '', \
jiggle(dpcos(x)) ls 2 t 'Damped Cos',\
jigglea((x/15)**2) ls 10 t '',\
jigglea((x/15)**2) ls 11 t ''
Created by rfonseca in his copious free time...
Hosted on GitHub Pages — Theme by orderedlist